Vitally Features
Customer Success Dashboards & Reporting Software
Bring all your customer data under one roof and create dashboards with Vitally’s powerful Customer Success Platform.


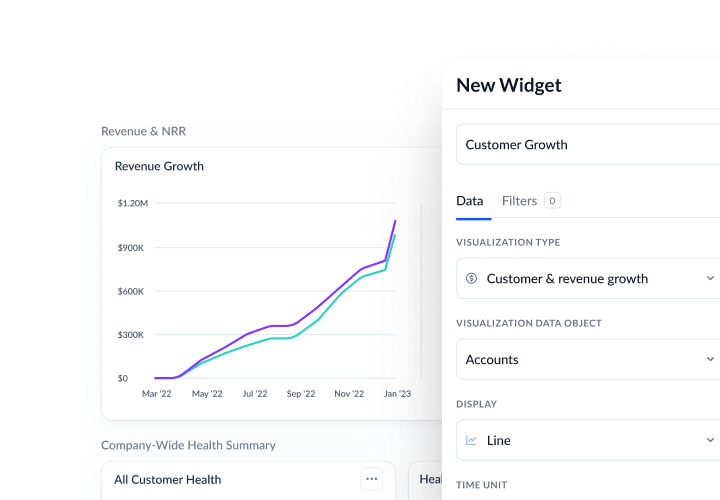
Visualize Every Customer Trend & Outcome
Vitally Dashboards give you real-time insights into customer health, engagement, and outcomes — built on your CS data, not BI tooling.
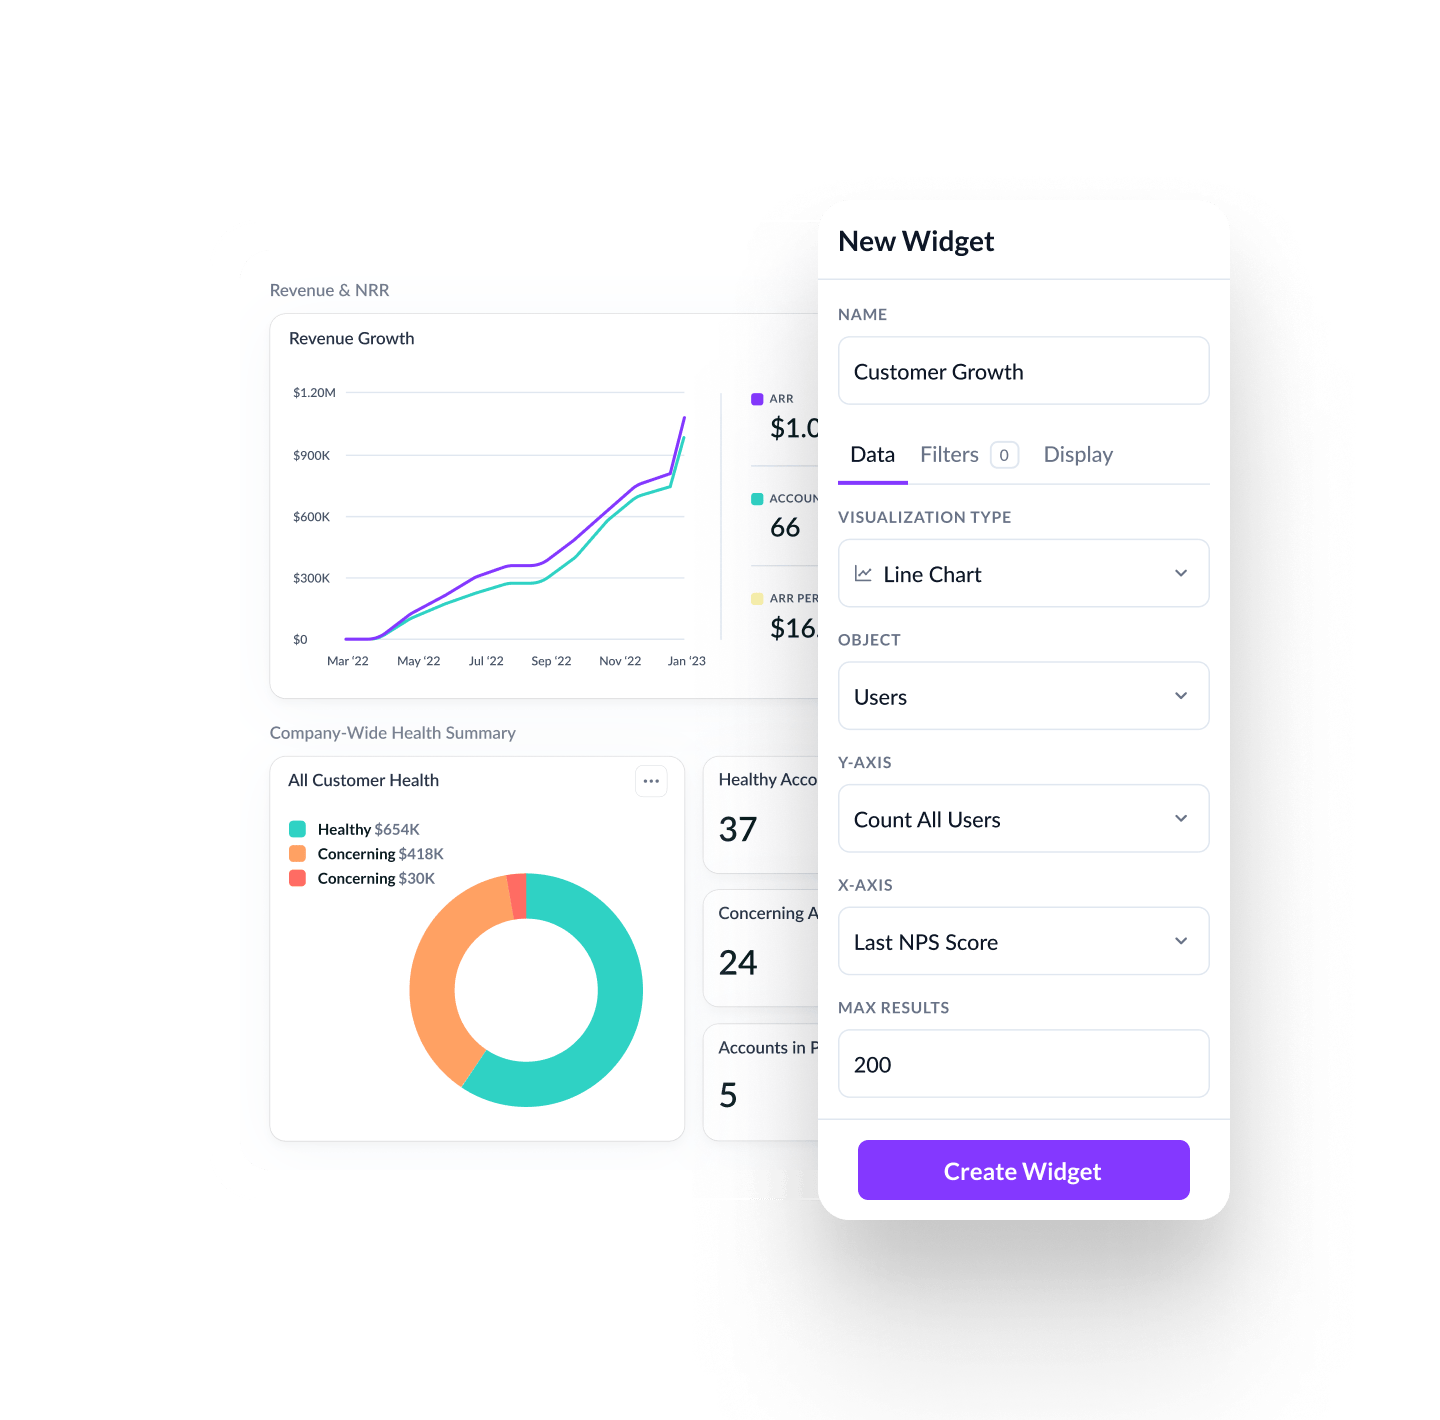
Track key metrics like health scores, product usage, and survey responses across accounts and segments — with flexible dashboards you can build and share, no analyst required.
Build reports filtered by segment, stage, product plan, or custom traits to understand what’s driving risk, retention, or satisfaction across your customer base.
Embed dashboards into Docs for QBRs or pin them to 360 Profiles and Hubs — so critical metrics are visible exactly where they’re needed.
600+ CS Teams Are Scaling With Vitally


“We have a better idea about what features our customers are using and how that relates to churn and retention.”
FAQ
What makes Vitally’s Dashboards purpose-built for CS teams?
Vitally Dashboards are designed specifically for Customer Success. They visualize your operational data — from health scores to onboarding progress — in ways that help teams prioritize, act, and report value clearly, without needing external tools or analyst support.
What kind of metrics and data can I report on?
You can build dashboards using:
- Health Scores and Success Metrics
- NPS and Custom Survey results
- Onboarding and implementation progress
- Product usage and engagement metrics
- Key traits (e.g., MRR, lifecycle stage, plan type)
- Segment-based trends over time
Because Vitally tracks this data natively, you can build reports without needing additional integrations or exports.
Can I share Dashboards outside of Vitally?
Yes. Dashboards can be:
- Embedded into Docs for QBRs and customer updates
- Linked internally for exec visibility
You control how and where dashboards are shared — without needing a BI platform.
Can I use Dashboards to track outcomes across segments?
Absolutely. Vitally lets you filter dashboards by any trait in your data model — such as:
- Lifecycle Stage
- Plan Type or ARR Tier
- Product Region or Vertical
- Segment or CSM assignment
This helps you identify trends, risk, and performance differences across your customer base — and take action accordingly.
What’s the difference between Dashboards and 360 Views?
Dashboards are for analyzing trends across multiple accounts — ideal for strategy, reporting, and planning. 360 Views focus on individual customers — showing key data like health, usage, and activity history in one place. Both work together to give CS teams a complete view at both macro and micro levels.
Explore the Product
Productivity
Give your team all the tools they need to build and automate how they get work done.
Collaboration
Increase customer transparency to reach new milestones with customers.
Visibility
Discover actionable insights to drive your book of business, inform strategies, and keep data flowing.
Vitally AI
Purpose-built AI for scaled CS to reduce churn, unlock growth, and stay a step ahead.