
Article Overview
- The average churn rate for B2B SaaS companies in 2025 is 3.5%—but voluntary and involuntary churn require completely different strategies to manage effectively.
- Price matters: Higher ARPU customers churn less, but only when onboarding, product value, and support scale with complexity.
- Retention is your growth engine: With sales slowing, companies with strong Net Revenue Retention (NRR) are best positioned to grow efficiently—especially in uncertain markets.
Churn is the silent killer of recurring revenue.
Whether you’re a seed-stage SaaS founder or an enterprise growth exec, customer churn is the metric that keeps revenue leaders up at night. The impact of churn ripples far beyond lost MRR, it affects your CAC payback, LTV projections, and ultimately, investor confidence.
In this guide, we’ll unpack the most recent churn rate benchmarks for B2B SaaS companies so you can see how you stack up. We’ll also explore how company size, revenue per user, and churn type (voluntary vs. involuntary) play a role. Finally, we’ll wrap up with a variety of strategies to fight churn with precision.
What Is a “Good” Churn Rate for B2B SaaS?
According to the 2025 Recurly Churn Report, the average churn rate for B2B SaaS companies is 3.5%, split between:
- Voluntary churn (customer-initiated cancellations): 2.6%
- Involuntary churn (payment failures and billing issues): 0.8%

This represents a relatively healthy churn rate by industry standards. For context, consumer-facing SaaS (especially in digital media, retail, and education) often experiences churn in the 6.5–8% range due to shorter contract durations, lower switching costs, and greater price sensitivity.
Key Takeaway
If your B2B SaaS churn is below 5%, you’re on solid ground. But any level of churn deserves scrutiny, especially if it’s persistent, trending upward, or concentrated among key customer segments.
Churn Benchmarks by ARPU: Why Price Impacts Retention
One of the clearest trends in SaaS churn data is the relationship between how much customers pay and how likely they are to stick around.
Baremetrics’ Open Benchmarks report, based on anonymized data from real subscription companies, offers insight into churn based on average revenue per user (ARPU). Here’s a breakdown:
Customers paying more than $250 per month have the lowest churn rates. These accounts often involve more complex onboarding, deeper integrations, and greater organizational dependencies, making switching costly.
Why This Matters
Your pricing strategy influences not just revenue, but retention. High ARPU customers can deliver higher LTV and more predictable revenue—provided your product delivers enough ongoing value to justify the price. We’ll talk more about delivering consistent value later in this guide.
The Economic Impact of Churn
The financial consequences of churn go far beyond lost revenue. As Saravana Kumar writes in Forbes, “the cost of acquiring a new customer is 5x higher than retaining an existing one.”
Retention fuels everything from expansion revenue to customer advocacy:
- A 5% improvement in retention can drive 25%+ increase in profits over time.
- Satisfied customers are more likely to upgrade, renew annually, and refer others.
- Churn undermines CAC payback models and burns valuable cash during growth phases.
For growing SaaS companies, this underscores the importance of retention as a growth lever, not just a defensive metric.
Voluntary vs. Involuntary Churn: What to Watch For
Understanding why customers churn is essential to reducing it. According to Recurly:
- Voluntary churn stems from dissatisfaction, lack of perceived value, or competitor switching.
- Involuntary churn is typically the result of failed payments, expired cards, or technical billing issues.
While voluntary churn requires product, success, and support improvements, involuntary churn is highly fixable with the right tools.
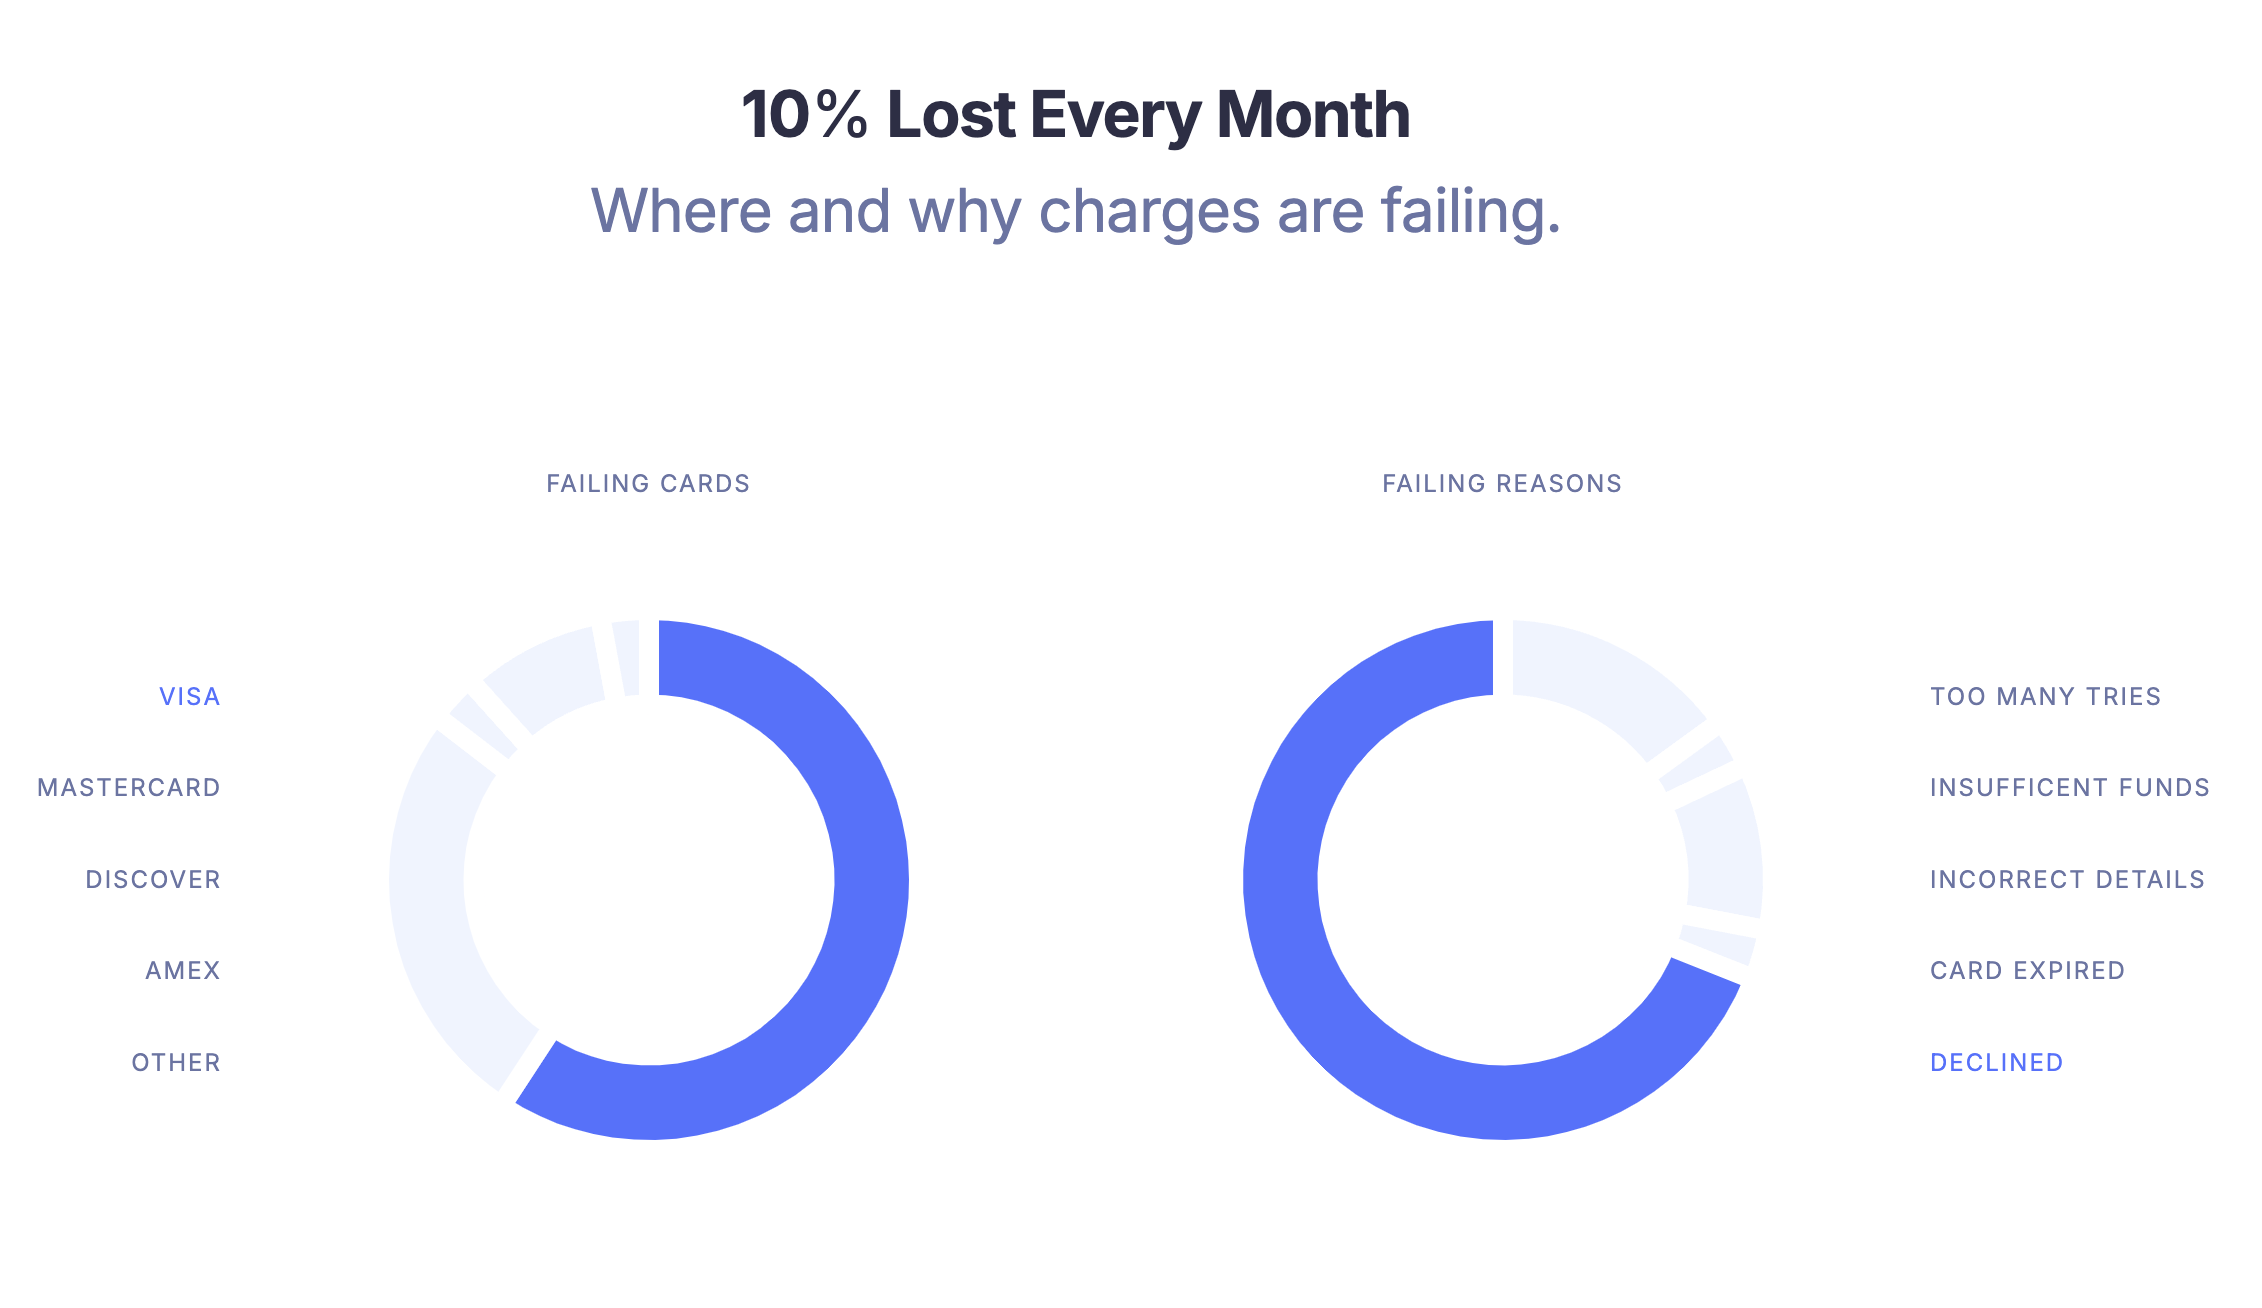
According to Recurly, involuntary churn in B2B SaaS averages just 0.8%, yet fixing it can lift revenue by 8.6% in year one. So be sure to use automated card updaters, smart retry logic, dunning workflows, and grace periods to prevent avoidable revenue loss.
What the Latest SaaS Growth Metrics Reveal
The October 2024 SaaS Market Report from Paddle (via ProfitWell) paints a clear picture: retention is doing the heavy lifting in an uncertain growth environment.
Here’s what the data shows:
- New sales dropped by 3.3%
- Churn declined by 3.3%
- Downgrades fell by 7.0%

At first glance, this looks like a mixed bag, but there are three key takeaways for SaaS leaders:
1. Churn Is Becoming a Competitive Differentiator
The simultaneous drop in churn and sales suggests that while companies may be struggling to grow top-line revenue through acquisition, they are doing better at holding onto existing customers.
In tight markets, the businesses that retain more revenue, especially through expansions and renewals, are better positioned to maintain MRR and withstand slow quarters. This makes churn reduction and net revenue retention (NRR) key performance indicators, not just support metrics.
2. Growth from Existing Customers Is More Reliable
With downgrades falling and churn improving, it’s clear that upsell, cross-sell, and strong Customer Success motions are critical. SaaS companies are starting to shift their growth strategies from acquisition-heavy models to land-and-expand models, relying on existing accounts for more predictable revenue.
Implication: If your business still prioritizes new logos over expansion revenue, it may be time to rebalance.
3. Net New Sales Are Vulnerable to External Shocks
The dip in new sales, driven in part by seasonal factors (like simultaneous U.S. and Canadian holidays), reveals how fragile top-of-funnel growth can be. This reinforces the need for a strong retention engine—because you can’t always rely on new sales to hit your numbers.
Even a temporary sales dip can derail your forecasts if churn isn’t tightly controlled.
NRR Is the New Growth Engine
In this climate, NRR is emerging as the most important health metric for SaaS businesses. Companies with high NRR can continue to grow even with flat new sales. Those with low NRR need aggressive acquisition just to stay afloat. If you’re a revenue leader, you should:
- Invest in onboarding, usage tracking, and Customer Success to keep churn low.
- Build account expansion programs that drive upgrades and deeper adoption.
- Align GTM and product teams around customer value, not just logo acquisition.
The takeaway is simple: the fastest-growing SaaS companies aren’t just adding new revenue, they’re keeping and expanding what they already have.
Best Practices for Reducing SaaS Churn
The first 30 to 90 days after a customer signs up are the most important in defining the lifetime of that account.
Most churn signals emerge during this window, often silently. If customers encounter friction, feel undersupported, or fail to achieve early wins, they’re far more likely to churn later. Here are five churn-reduction strategies built around this insight:
1. Nail the Onboarding Experience
Strong onboarding sets the tone for the entire customer relationship. When customers reach value quickly and know how to use your product, their likelihood of sticking increases significantly.
- Focus on time-to-value, not feature exposure—help customers achieve a quick win.
- Use structured check-ins and milestone tracking to guide them through early usage.
- Avoid overwhelming them. Teach what they need now; introduce more later.
Customers don’t churn because they don’t understand every feature, they churn because they don’t see results.
2. Monitor Early Warning Signals
Churn rarely comes without warning. Customers show signs—declining usage, rising support tickets, or disengagement. Key indicators include:
- Reduced product activity or logins
- Negative feedback or poor NPS/CSAT scores
- Champions going dark or leaving the company
- Repeated discount or cancellation requests
Use your Customer Success Platform (CSP) to surface these insights in real time so your team can act before it's too late.

For something more actionable, our Churn Report Blueprint helps Customer Success teams capture key insights at the moment of churn—from reasons and mitigation steps to synced account traits in Vitally. It’s an easy way to standardize your process and unlock trends that improve retention over time.

3. Close the Feedback Loop
Customers want to be heard, and more importantly, they want to see action. If users give feedback but nothing changes, trust erodes.
- Make feedback collection a regular practice—during onboarding, quarterly reviews, and after support interactions.
- Prioritize common pain points for product and support improvement.
- Communicate what you’ve changed based on their feedback.
This transparency can build loyalty and re-engage frustrated users.
4. Continuously Educate and Engage
Customer education shouldn’t stop after onboarding. As your product evolves, so do customer needs and expectations.
- Share tutorials, feature updates, and use cases that align with their goals.
- Use in-product messages and lifecycle emails to highlight new value.
- Help users go from competent to power users—this deepens stickiness.
Educated customers are not only more likely to renew, but also more likely to expand and refer others.
5. Segment and Personalize Outreach
Not all churn risk looks the same. Segmenting customers by revenue, behavior, or lifecycle stage helps pinpoint where intervention is most needed.
Examples of smart segmentation:
- By MRR: Are high-revenue accounts churning more than low-revenue ones?
- By signup date: Did a recent onboarding change improve retention?
- By behavior: Do users who skip a specific feature churn more often?
With this insight, you can run targeted campaigns, like reaching out to inactive users, offering added support to enterprise accounts, or adjusting onboarding for a specific cohort.
Benchmarking Your SaaS Churn with Caution
While churn benchmarks are useful, comparisons can be misleading. Not every SaaS business plays by the same rules. Here’s why:
- Company maturity: Established companies with strong brands typically churn less than early-stage startups.
- Customer type and contract size: Enterprise customers have lower churn due to high switching costs, while SMBs churn more often and more quickly.
- Business model: Growth-at-all-costs companies may chase volume over fit, attracting users who were never likely to stay.
- Product elasticity: Some products are easier to walk away from—especially in competitive or commoditized categories.
- External forces: Industry regulations, economic shifts, and seasonality can all temporarily skew churn rates.
Before using churn benchmarks to judge performance, factor in your unique context—your ICP, pricing model, and product complexity.
Make Churn a Growth Lever, Not a Liability
Churn is a reflection of your customer experience, product value, and operational alignment. And while it’s inevitable that some customers will leave, unchecked churn will quietly undercut your growth, profitability, and long-term resilience.
The good news? Churn is also one of the most actionable metrics in SaaS.
Start by benchmarking your churn by ARPU, industry, and customer type. Diagnose the root causes—whether it’s onboarding friction, billing failures, or a value gap. Then invest in the right systems, tools, and teams to reduce churn proactively, not reactively.
Treat churn like a product problem, not just a support one. Own it at the leadership level. Build it into your Customer Success strategy, your pricing model, and your roadmap.
The SaaS companies that will win in 2025 are those that retain customers better than they acquire them. They’ll have stronger customer relationships, more predictable revenue, and more efficient growth. And in a market where every dollar counts, that’s a serious competitive advantage.
Ready to Take Control of Churn?
At Vitally, we help B2B SaaS teams unify customer data, automate proactive outreach, and identify churn risks before they happen. Whether you’re looking to tighten up onboarding, improve your CS team’s efficiency, or get a clearer picture of customer health, we’re here to help.
Book a personalized demo or take a self-guided tour of Vitally today.
Table of Contents
Request a Demo
Request a Demo
Request a Demo